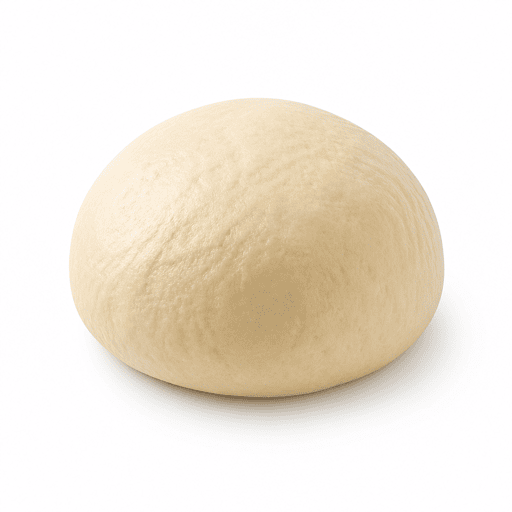
Pâte à pizza
100 g of Pâte à pizza provides 240 kcal, with 7.05 g of protein, 44.2 g of carbohydrates and 3.45 g of fat (CIQUAL 2020 table, ANSES).
- Low sugar
- Low sodium
Calories
240 kcal
Protein
7.05 g
Carbohydrates
44.2 g
Fat
3.45 g
Full nutrition table
Values per 100 g of edible portion (CIQUAL 2020).
Macronutrients
| Macronutrients | Value per 100 g | % RI |
|---|---|---|
| Calories | 240 kcal | 12 % |
| Protein | 7.05 g | 14 % |
| Carbohydrates | 44.2 g | 17 % |
| Fat | 3.45 g | 4.9 % |
| Fiber | 2.2 g | 7.3 % |
| Sugars | 1.4 g | 1.6 % |
| Sodium | 0.63 mg | 0 % |
Minerals
| Minerals | Value per 100 g | % RI |
|---|---|---|
| Calcium | — | — |
| Iron | — | — |
| Magnesium | — | — |
| Phosphorus | — | — |
| Potassium | — | — |
| Sodium | 1.31 mg | 0.1 % |
| Zinc | — | — |
| Copper | — | — |
| Manganese | — | — |
| Selenium | — | — |
| Iodine | — | — |
Vitamins
| Vitamins | Value per 100 g | % RI |
|---|---|---|
| Vitamin A | — | — |
| Vitamin D | — | — |
| Vitamin E | — | — |
| Vitamin K1 | — | — |
| Vitamin C | — | — |
| Vitamin B1 (Thiamine) | — | — |
| Vitamin B2 (Riboflavin) | — | — |
| Vitamin B3 (Niacin) | — | — |
| Vitamin B5 (Pantothenic) | — | — |
| Vitamin B6 | — | — |
| Vitamin B9 (Folate) | — | — |
| Vitamin B12 | — | — |
% RI: share of the daily reference intakes for a typical adult (EU Regulation 1169/2011), computed per 100 g of edible portion.
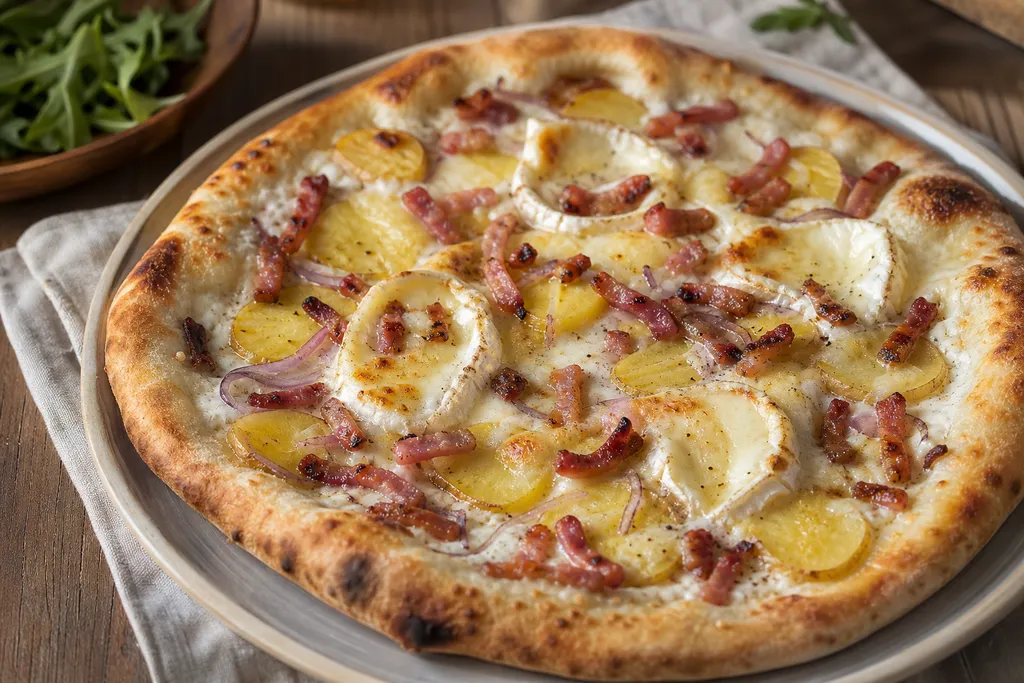
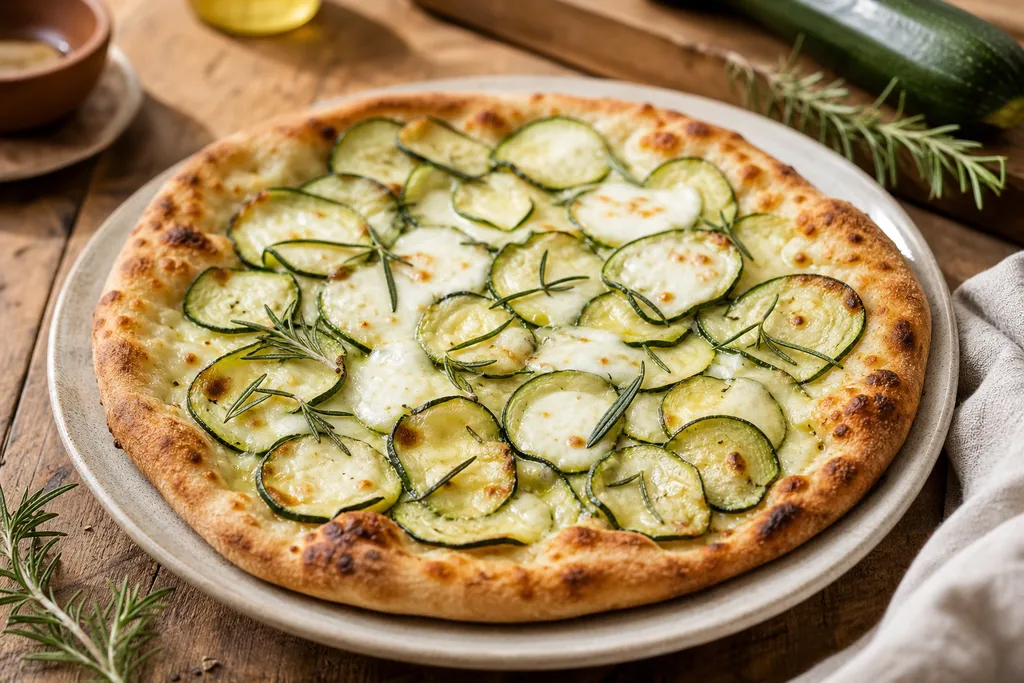
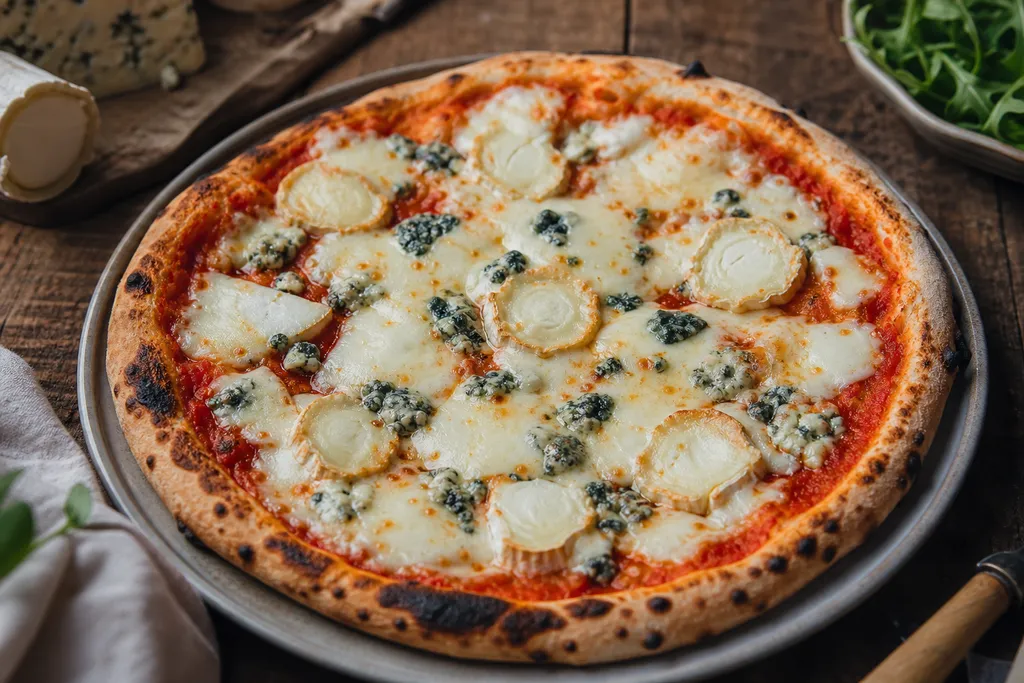
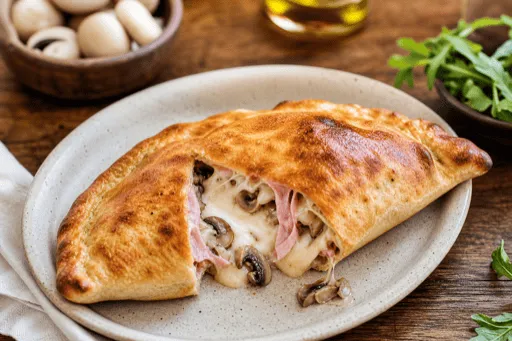
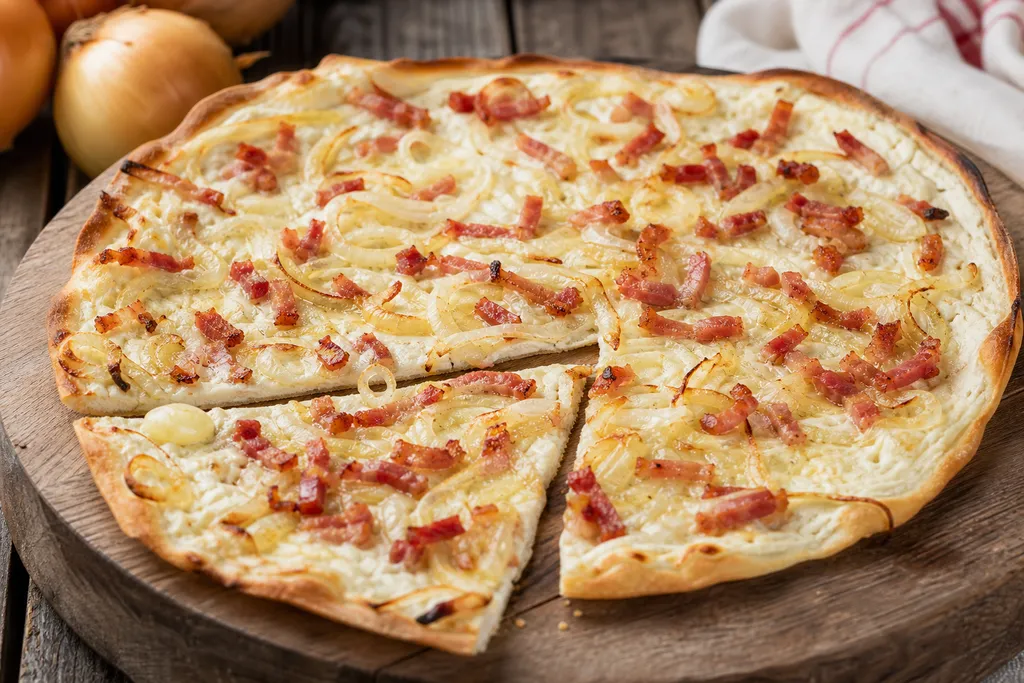
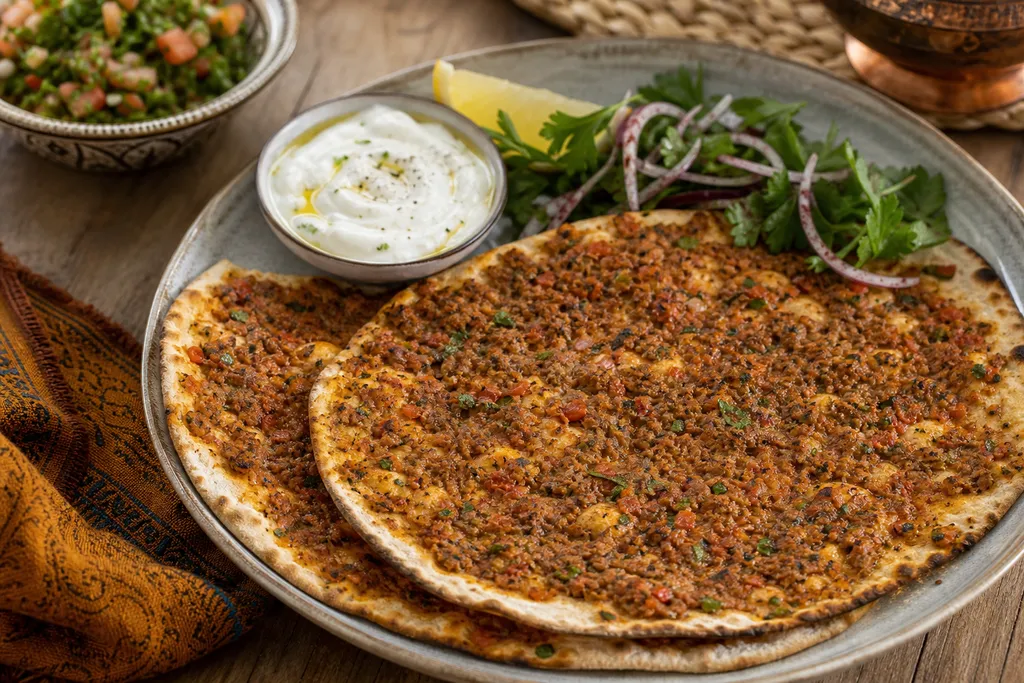
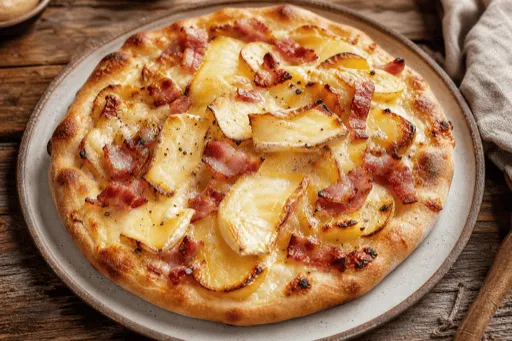
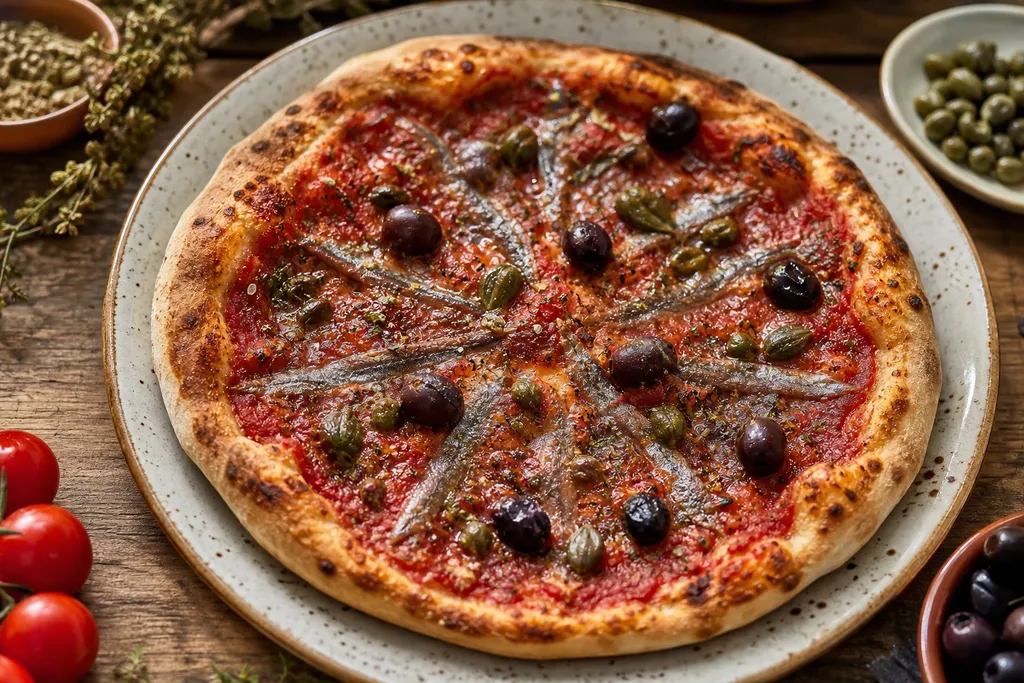
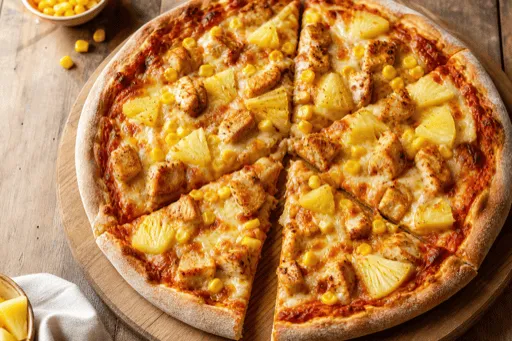
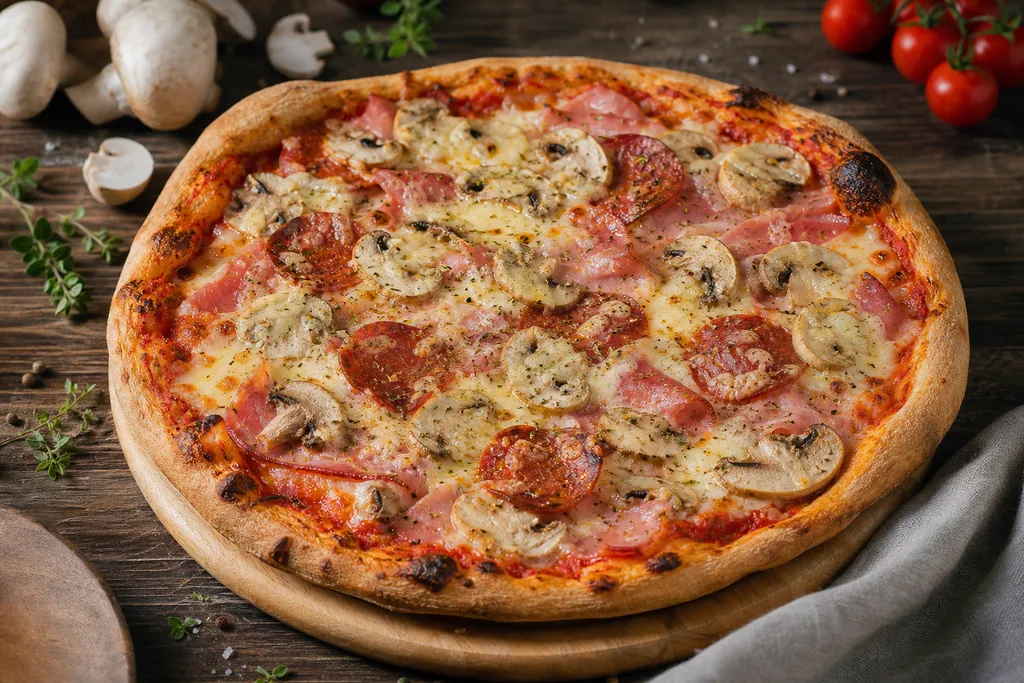
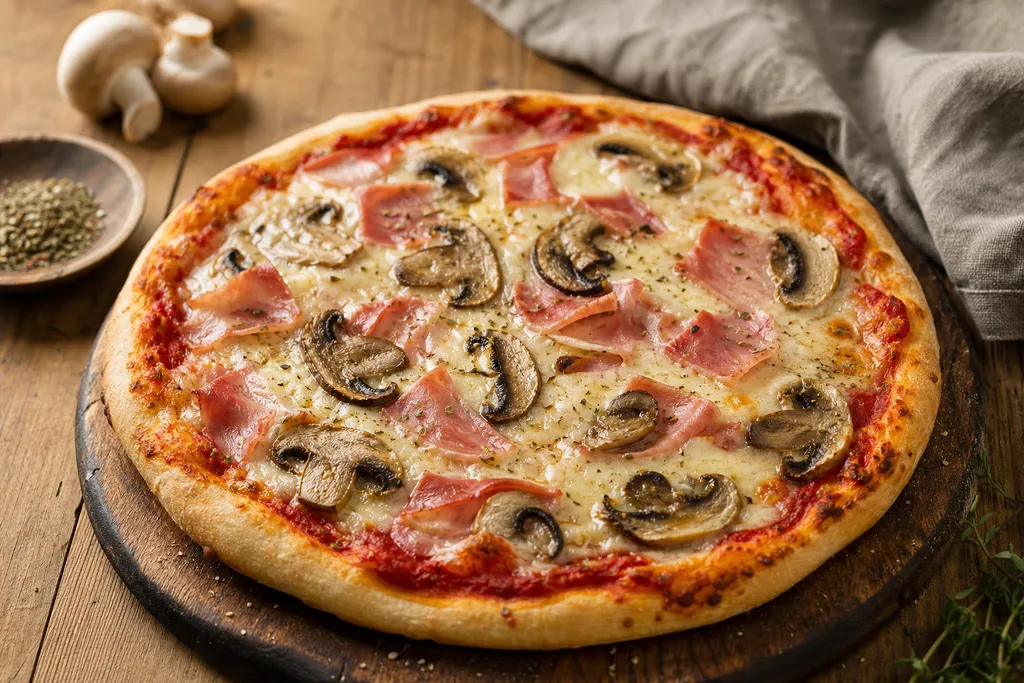
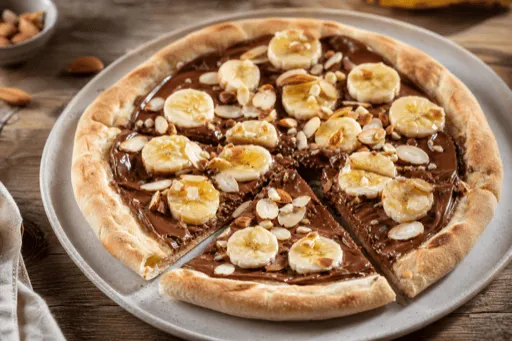
Recipes using Pâte à pizza
Recipes from the Magic List community that highlight this ingredient.
Frequently asked questions about Pâte à pizza
How many calories in 100 g of Pâte à pizza?
100 g of Pâte à pizza provides 240 kcal, with 7.05 g of protein, 44.2 g of carbohydrates and 3.45 g of fat (edible portion, CIQUAL 2020 table by ANSES).
How much protein in 100 g of Pâte à pizza?
100 g of Pâte à pizza provides 7.05 g of protein, about 14% of the daily reference intake (50 g for a typical adult).
Which vitamins and minerals does Pâte à pizza provide?
Per 100 g, Pâte à pizza does not reach the “source” threshold (15% of reference intakes) for any major micronutrient. The table above lists every measured value.
Where do the nutrition values on this page come from?
Values come from the CIQUAL 2020 composition table published by ANSES, the French food safety agency. They are expressed per 100 g of edible portion and can vary with variety, season and cooking method.
Similar ingredients
Other ingredients in the same family.