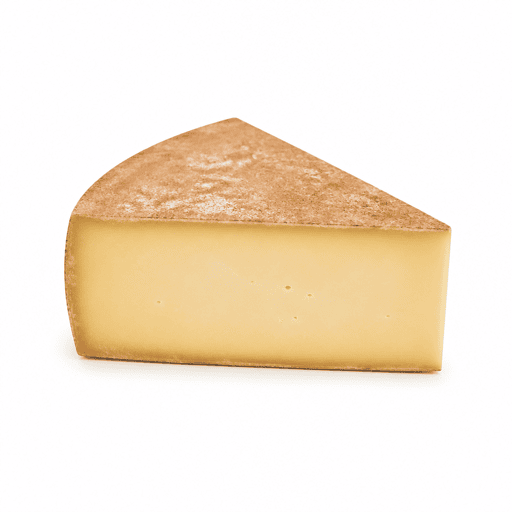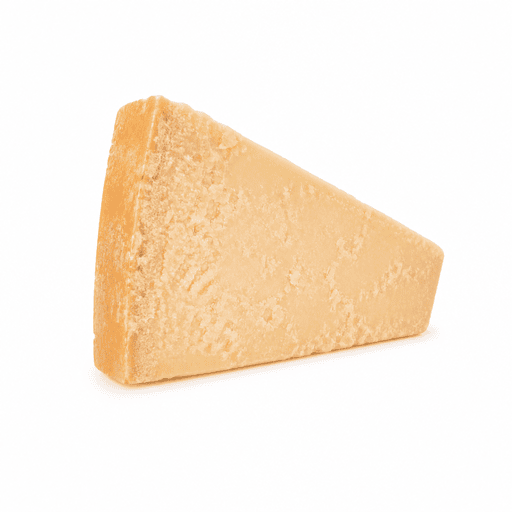
Parmesan
100 g of Parmesan provides 411 kcal, with 31.1 g of protein, 1.14 g of carbohydrates and 31 g of fat (CIQUAL 2020 table, ANSES).
- High in protein
- Low sugar
- Low sodium
Calories
411 kcal
Protein
31.1 g
Carbohydrates
1.14 g
Fat
31 g
Full nutrition table
Values per 100 g of edible portion (CIQUAL 2020).
Macronutrients
| Macronutrients | Value per 100 g | % RI |
|---|---|---|
| Calories | 411 kcal | 21 % |
| Protein | 31.1 g | 62 % |
| Carbohydrates | 1.14 g | 0.4 % |
| Fat | 31 g | 44 % |
| Fiber | 0 g | 0 % |
| Sugars | 0 g | 0 % |
| Sodium | 0.63 mg | 0 % |
Minerals
| Minerals | Value per 100 g | % RI |
|---|---|---|
| Calcium | 980 mg | 123 % |
| Iron | 0.1 mg | 0.7 % |
| Magnesium | 40 mg | 11 % |
| Phosphorus | 630 mg | 90 % |
| Potassium | 110 mg | 5.5 % |
| Sodium | 1.57 mg | 0.1 % |
| Zinc | 3.9 mg | 39 % |
| Copper | 0.71 mg | 71 % |
| Manganese | 0.02 mg | 1 % |
| Selenium | 20 µg | 36 % |
| Iodine | 90 µg | 60 % |
Vitamins
| Vitamins | Value per 100 g | % RI |
|---|---|---|
| Vitamin A | 336 µg | 42 % |
| Vitamin D | 0.13 µg | 2.5 % |
| Vitamin E | — | — |
| Vitamin K1 | 1.53 µg | 2 % |
| Vitamin C | 0.25 mg | 0.3 % |
| Vitamin B1 (Thiamine) | 0.01 mg | 0.7 % |
| Vitamin B2 (Riboflavin) | 0.26 mg | 19 % |
| Vitamin B3 (Niacin) | 1.23 mg | 7.7 % |
| Vitamin B5 (Pantothenic) | 0.34 mg | 5.7 % |
| Vitamin B6 | 0.18 mg | 13 % |
| Vitamin B9 (Folate) | 16 µg | 8 % |
| Vitamin B12 | 2.64 µg | 106 % |
% RI: share of the daily reference intakes for a typical adult (EU Regulation 1169/2011), computed per 100 g of edible portion.
Recipes using Parmesan
Recipes from the Magic List community that highlight this ingredient.
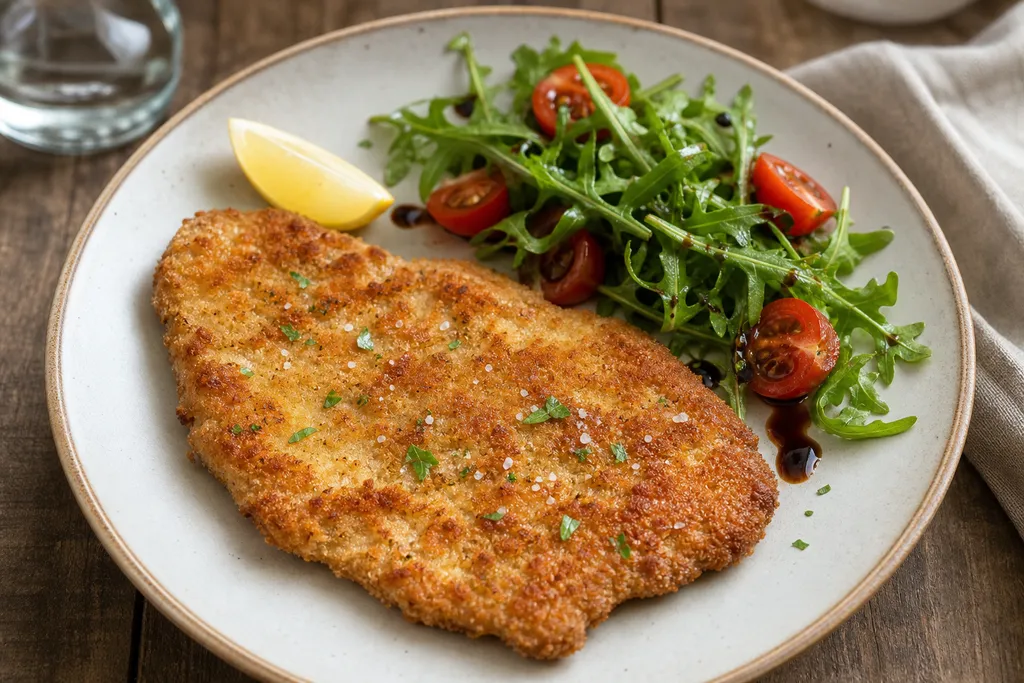
Escalope à la Milanaise
35 min
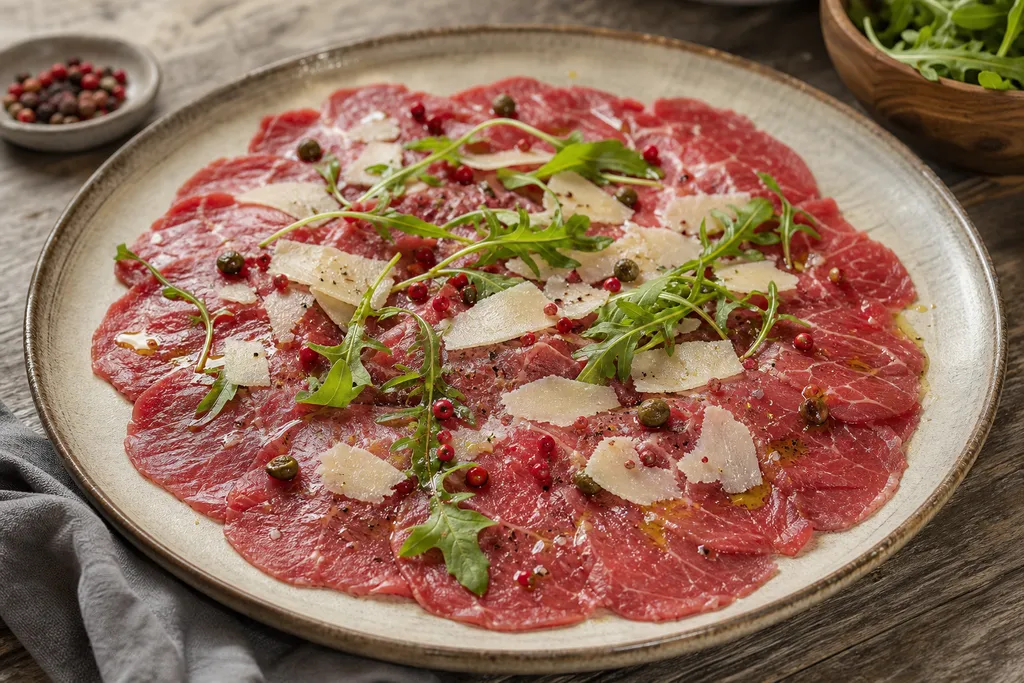
Carpaccio de Bœuf
20 min
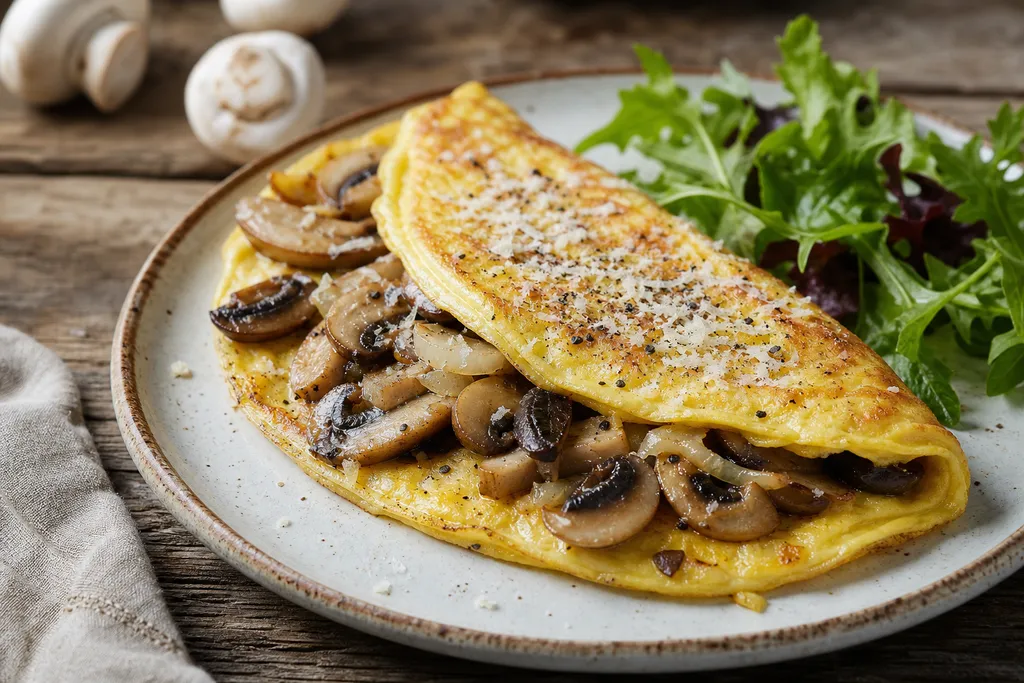
Omelette aux Champignons
15 min
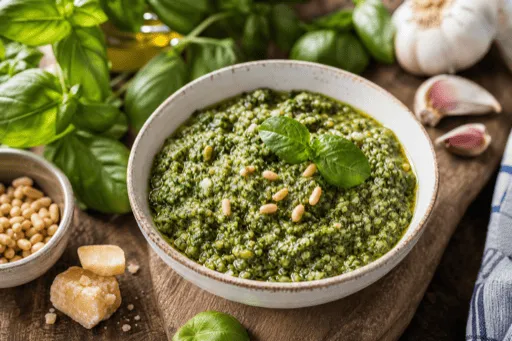
Pesto
15 min
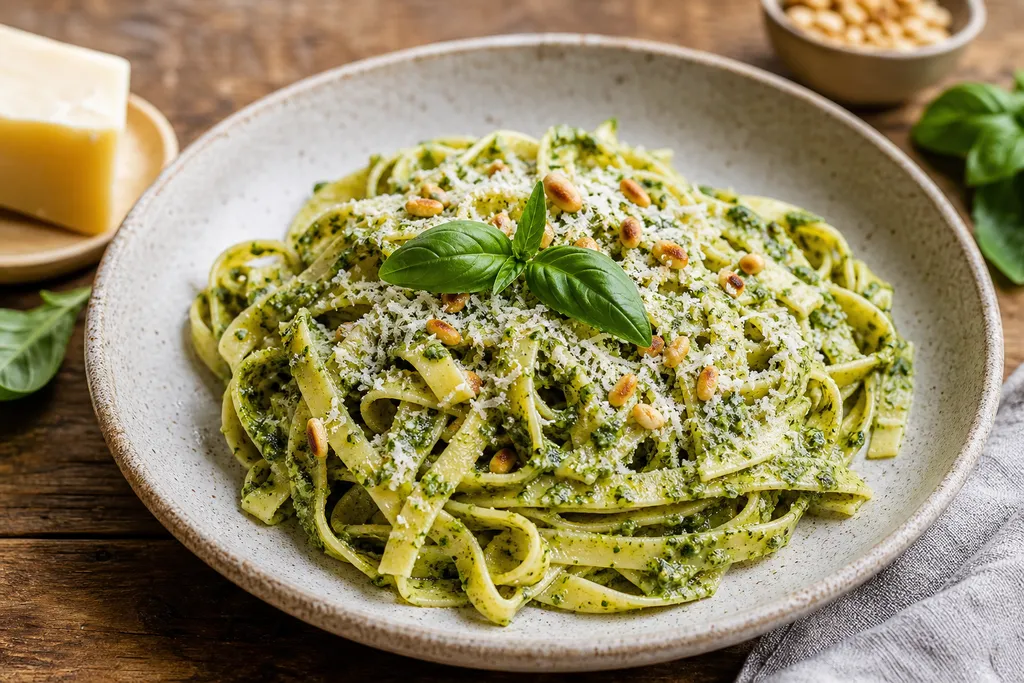
Pâtes au Pesto
30 min
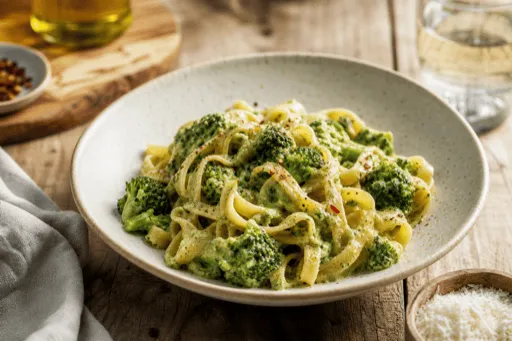
Pâtes au Brocoli
40 min
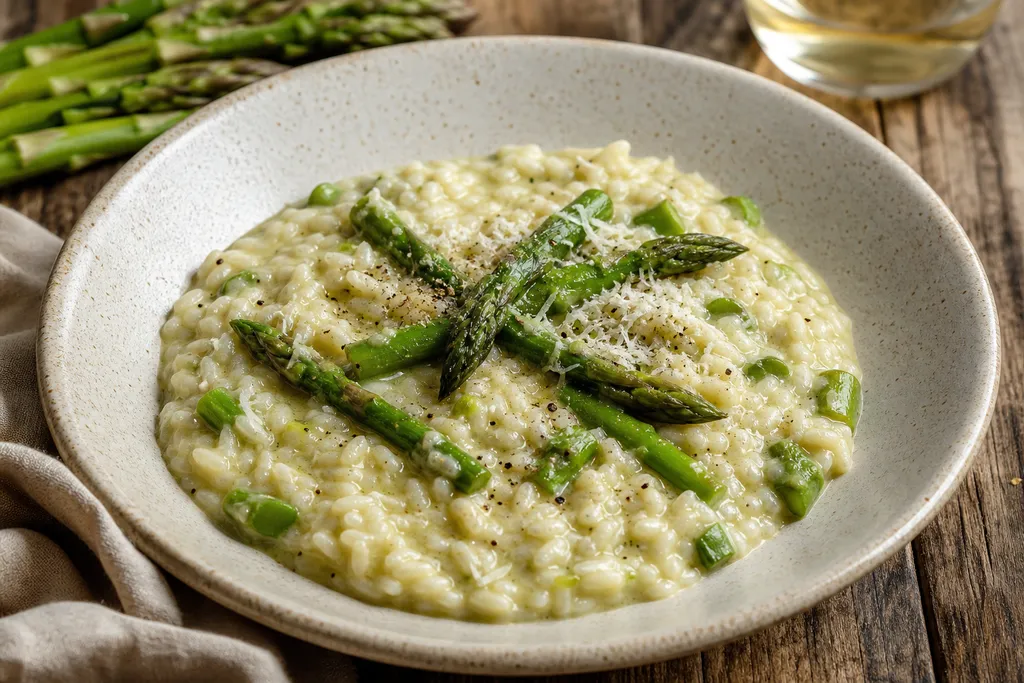
Risotto aux Asperges
40 min
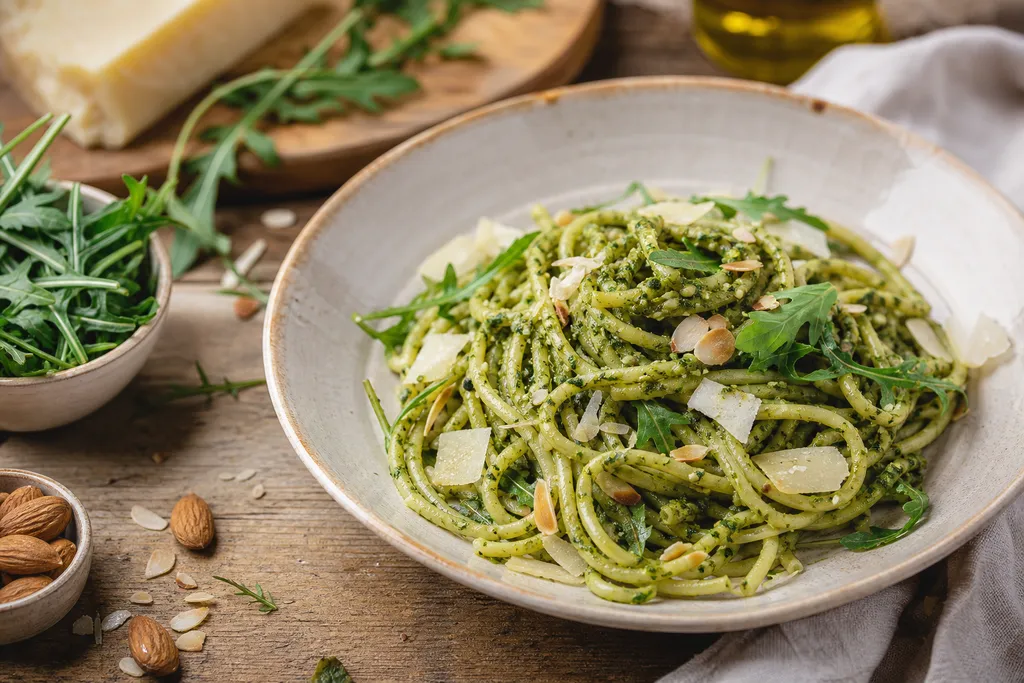
Pesto de Roquette
10 min
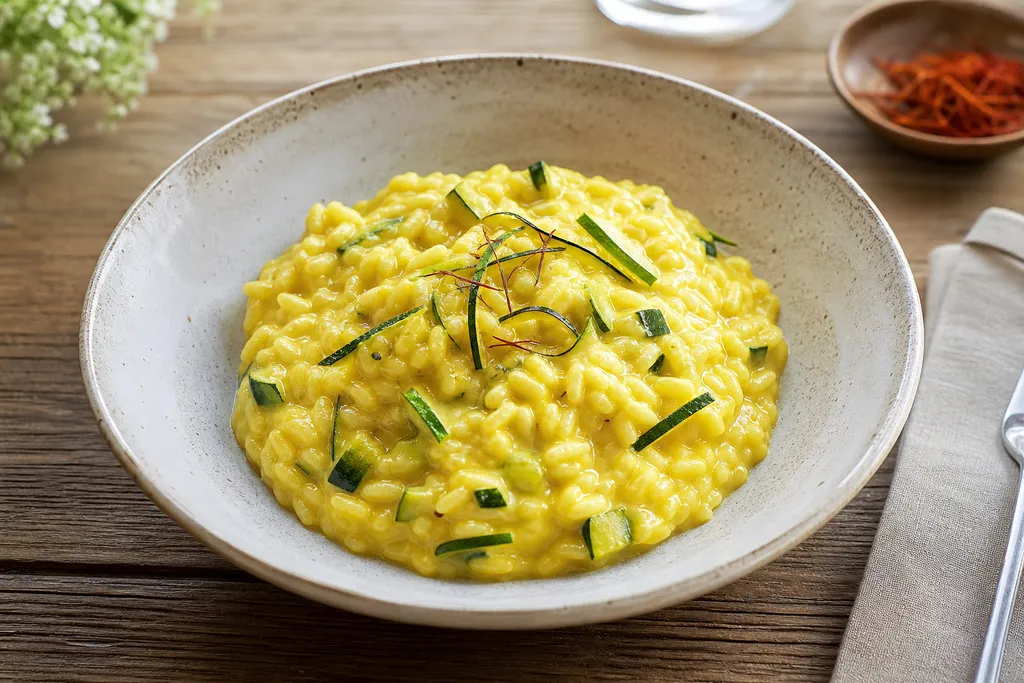
Risotto à la Courgette
35 min
Escalope de Dinde à l'Italienne
35 min
Spaghetti aux Fruits de Mer
45 min
Crumble Salé
50 min
Frequently asked questions about Parmesan
How many calories in 100 g of Parmesan?
100 g of Parmesan provides 411 kcal, with 31.1 g of protein, 1.14 g of carbohydrates and 31 g of fat (edible portion, CIQUAL 2020 table by ANSES).
How much protein in 100 g of Parmesan?
With 31.1 g of protein per 100 g, more than 20% of the energy of Parmesan comes from protein: the “high in protein” threshold defined by EU Regulation (EC) 1924/2006.
Which vitamins and minerals does Parmesan provide?
Per 100 g, Parmesan covers a notable share of the reference intakes for: Calcium (123 %), Vitamin B12 (106 %), Phosphorus (90 %), Copper (71 %), Iodine (60 %), Vitamin A (42 %). A food is considered a “source” of a nutrient from 15% of the reference intakes per 100 g.
Where do the nutrition values on this page come from?
Values come from the CIQUAL 2020 composition table published by ANSES, the French food safety agency. They are expressed per 100 g of edible portion and can vary with variety, season and cooking method.
Similar ingredients
Other ingredients in the same family.